Predictive Analytics for Power Grids

Meteomonitoring

A software solution for early detection and forecasting of icing and frost deposits on overhead transmission lines. No sensors. No telemetry. Full route coverage.

/01
1—3 days
Forecast Horizon
/02
100%
Transmission Line Coverage
/03
0 sensors
No Hardware Installation
/04
24/7
Autonomous Monitoring
/01 — About

Technology for Reliable Power Systems

RUARRI LLC is a technology company focused on intelligent solutions for the electric power industry. We develop software and deliver it as a cloud service: all data is collected, processed, and delivered to the customer over the internet on a subscription basis, with no need to deploy complex infrastructure.

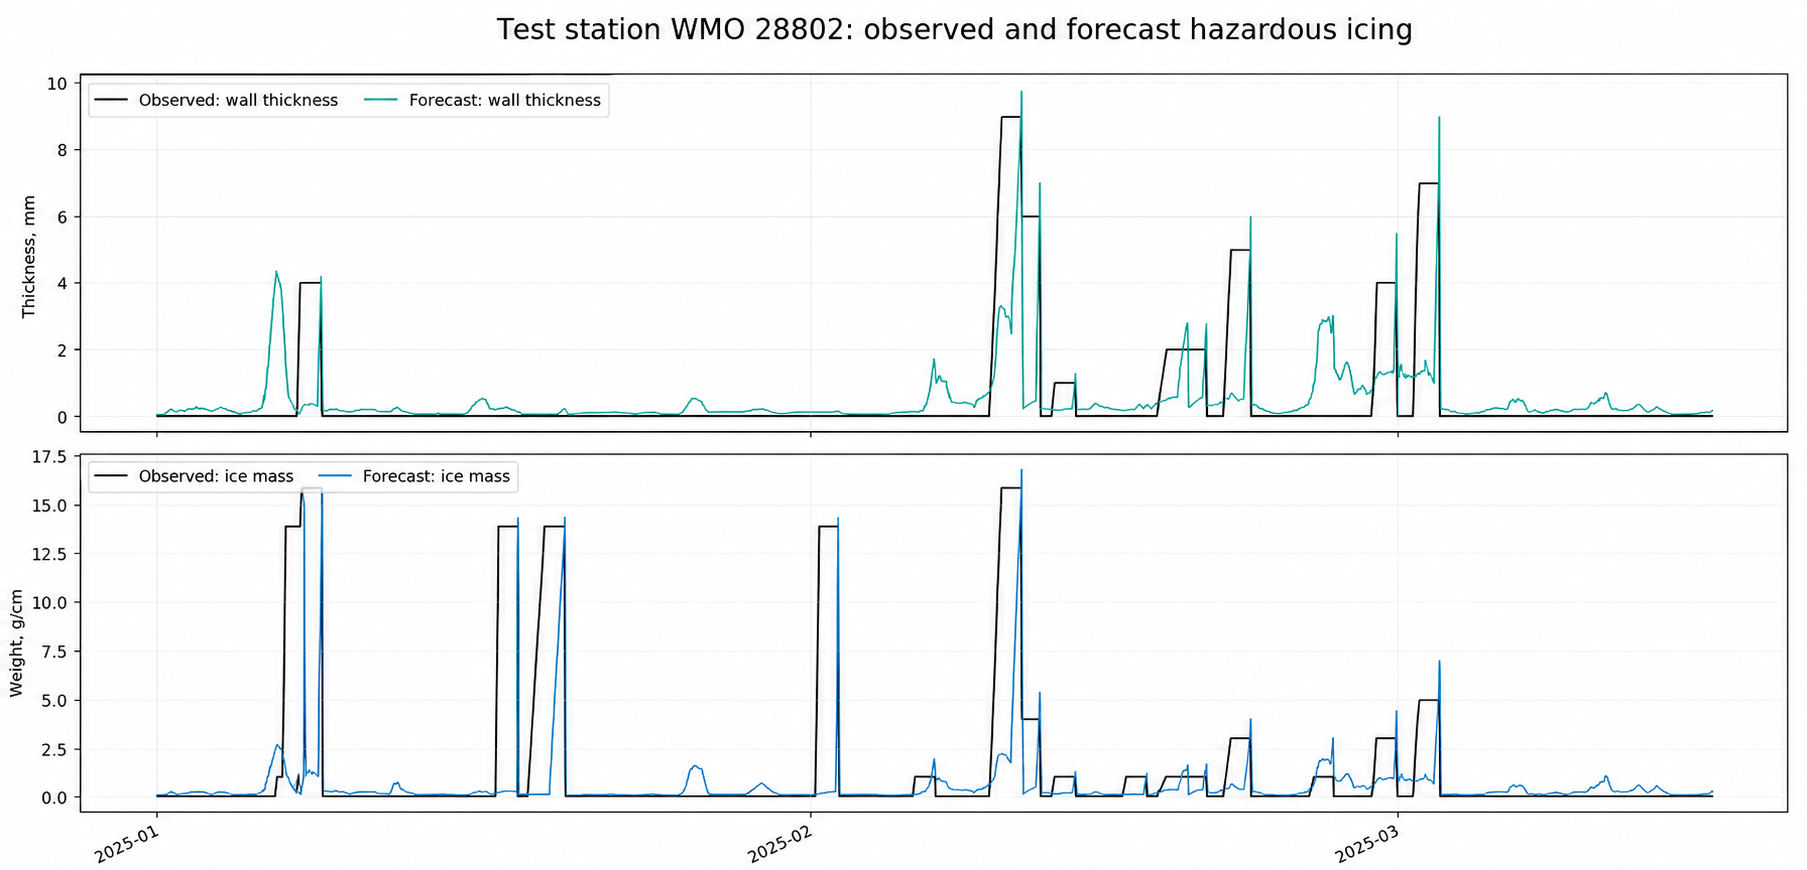
Our core focus is forecasting and analysis of icing loads on overhead transmission lines. Our technology makes it possible to identify high-risk sections in advance and prevent outages, providing full visibility across the entire line route regardless of its length.

SaaS Machine Learning Weather Modeling Power Engineering
RUARRI Logo // Identity Mark
/02 — Solution

Meteomonitoring Solution

A fully software-based solution for decision support in the operation of overhead transmission lines.

The solution is designed for early detection and forecasting of icing and frost deposits and provides accurate, detailed information across the full length of the line.

The key advantage of the solution is that it eliminates the need to install sensors or telemetry on the line.

This significantly reduces capital and operating costs and removes dependence on the condition of measurement equipment.

To get started, the system only requires historical data on actual icing and frost deposit events. This is used during model adaptation to the specific conditions of the transmission line route, after which forecasting runs fully autonomously based on external data.

Forecasts are generated for 1 to 3 days ahead and cover 100% of the transmission line route, including hard-to-access sections.

Chart of observed and forecast hazardous icing data
// SYSTEM SIGNATURE
/03 — Data

What Data We Process

/ 01

Deposit Type

Glaze ice, wet snow, granular or crystalline frost, or no deposits.

/ 02

Ice Thickness (mm)

Calculated ice sheath thickness on the conductor surface, mapped to transmission line sections.

/ 03

Mechanical Load (kg)

Assessment of icing impact on the conductor and line support structures.

/ 04

Probability of Icing

Forecast in percent for each tower and each day of observation.

/ 05

High-Risk Zones

Precise coordinates of problem areas for priority monitoring.

/ 06

Line Identification

Mapped to a specific overhead line and its individual sections.

/04 — Technology

How It Works

The solution is built on integrated analysis of heterogeneous data. During implementation, historical icing and frost deposit event data is used to adapt and calibrate the model for a specific line.

Step 01

Data Source Collection

Integrated analysis of diverse information sources:

  • Numerical weather models (temperature, humidity, wind, pressure, precipitation)
  • Ground weather station data
  • Archives of actual icing and frost deposit events
  • Digital terrain models
Step 02

Model Adaptation

During implementation, historical data on icing and frost deposit events is used to adapt and calibrate the model for a specific line. This makes it possible to account for local route characteristics and significantly improves forecast accuracy. No additional line measurements are required for ongoing operation.

Step 03

Bias Correction

To improve accuracy, the solution applies a mechanism for correcting systematic weather model errors based on comparison with observed data. This enables continuous improvement in forecast quality over time as more statistics are accumulated.

Step 04

Feature Space

An extended feature space is also constructed:

  • Physical and thermodynamic atmospheric parameters
  • Terrain and local landscape features
  • Hydrological characteristics
  • Weather conditions over the previous 72 hours
/05 — Results

What You Get as Output

→ 01
Reduced Risk of Outages and Line Damage

Early identification of high-risk sections and a 1–3 day forecast make it possible to act before critical icing and frost deposits form.

→ 02
No Sensor Installation or Maintenance Costs

After model adaptation, forecasting runs autonomously based on external weather data, with no sensors or telemetry on the line.

→ 03
Full-Line Condition Monitoring, Not Just at Measurement Points

The forecast covers 100% of the transmission line route, including hard-to-access sections, with data linked to specific towers.

→ 04
Optimized Field and Maintenance Operations

Precise coordinates of high-risk zones make it possible to prioritize inspections and dispatch crews where they are truly needed.

→ 05
Improved Power Supply Reliability

Preventing icing-related outages directly improves the stability of power supply for consumers.

→ 06
Better Decisions Based on Accurate Forecast Data

Deposit type, ice thickness, mechanical load, and icing probability for each tower provide a solid basis for informed operational decisions.

Ready to Protect Your Line?

Contact us to discuss deployment of the Meteomonitoring solution at your facilities. We will demonstrate the platform in operation and prepare an estimate tailored to your infrastructure.

Request a Demo